Hello readers,
Welcome to the latest edition of The DeFi Report. We’ve got a chart-heavy report for you this week as we are laser-focused on data. Quality data & analytics provide the foundation to form strong, long-term convictions. With strong convictions, we can stay rooted and ignore the noise when the market gets turbulent.
This report starts with high-level framing before moving into a more granular analysis across L1s, DeFi, and a specific web3 project.
Topics Covered:
Long-Term Conviction Data
Macro Indicators
BTC KPIs
Layer 1 KPIs & Metrics
DeFi
Example Web3 Protocol Analysis
Disclaimer: Views expressed are the author's personal views and should not be taken as investment advice.
This issue of The DeFi Report is brought to you by Arcana Analytics. Backed by legendary investors such as Stan Druckenmiller, Arcana has the datasets, analysis tools, and investor process infrastructure that enables institutional investors to approach crypto seriously as an asset class.
To learn more, you can contact Arcana directly here — and don’t forget to tell them The DeFi Report sent you.
The DeFi Report is an exploration of the emerging web3 tech stack and an ongoing analysis of where value could accrue. We provide easy-to-follow mental models, frameworks, and data-driven analyses of DeFi and web3 business models.
Let’s go.
Long-Term Conviction: KPIs/Metrics
Crypto markets move in big cycles — driven largely by innovation/developer growth, venture capital, liquidity, media coverage, and the Bitcoin halving schedule.
Therefore, if you analyze data month-to-month or year-to-year, you will see volatility in the KPIs that can look similar to price volatility. We need to zoom out to find any real signal. We’re looking for data that can help us build long-term conviction — especially at the depth of a bear market when the crypto naysayers are out in force.
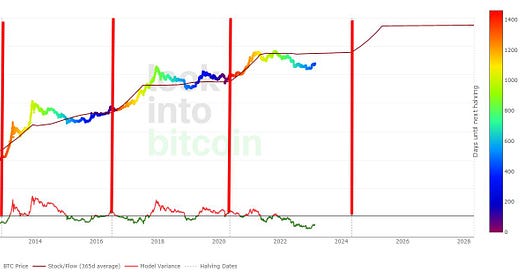
One of my favorite charts in crypto is Bitcoin’s log chart showing price action from inception — with the months from the next halving baked into the price via color coding.
I love this chart because it gives us a clear bird’s eye view. If we were to view Bitcoin’s long-term price action on a linear scale, it would look completely different — distorting the trend lines. We’d be looking at noise.
To validate what we see in the chart — which appears to be a long-term tech adoption cycle (with volatility) — we need additional data points. Stuff like total users/user growth, and developer/developer growth.
Total crypto users/owners are a good place to start. We can get an idea of this in two ways: exchange data (user accounts within exchange custody) and on-chain data (self-custody user wallet addresses).
Exchange User Data
Crypto.com uses mostly exchange data, with some “adjustments.” For example, Coinbase has 110 million verified users as reported in their 2022 10k. They take this (along with the rest of the top exchanges globally), and then extrapolate based on market share, make some adjustments, and get to 425 million crypto owners.
Now, is Crypto.com incentivized to overstate these numbers? Absolutely. Do some users have accounts at multiple exchanges? Certainly, which is apparently accounted for in the report. Do we think these numbers are likely to be high? Yes. But at least we have a starting point. Let’s look on-chain.
On-Chain Data
Bitcoin has 1.1 billion wallet addresses. Ethereum has 245 million wallet addresses. This is cold hard data from each immutable public blockchain ledger — showing addresses that have appeared in a transaction. That said, these numbers are high — one address does not equal 1 user since the same user could have multiple wallet addresses. Crypto.com reports 219 million Bitcoin owners and 87 million Ethereum owners at the end of 2022. When they factor in on-chain data, they assume every wallet that had assets in it still does today. Therefore, we need to look at non-zero wallet addresses.
Non-Zero Wallet Addresses
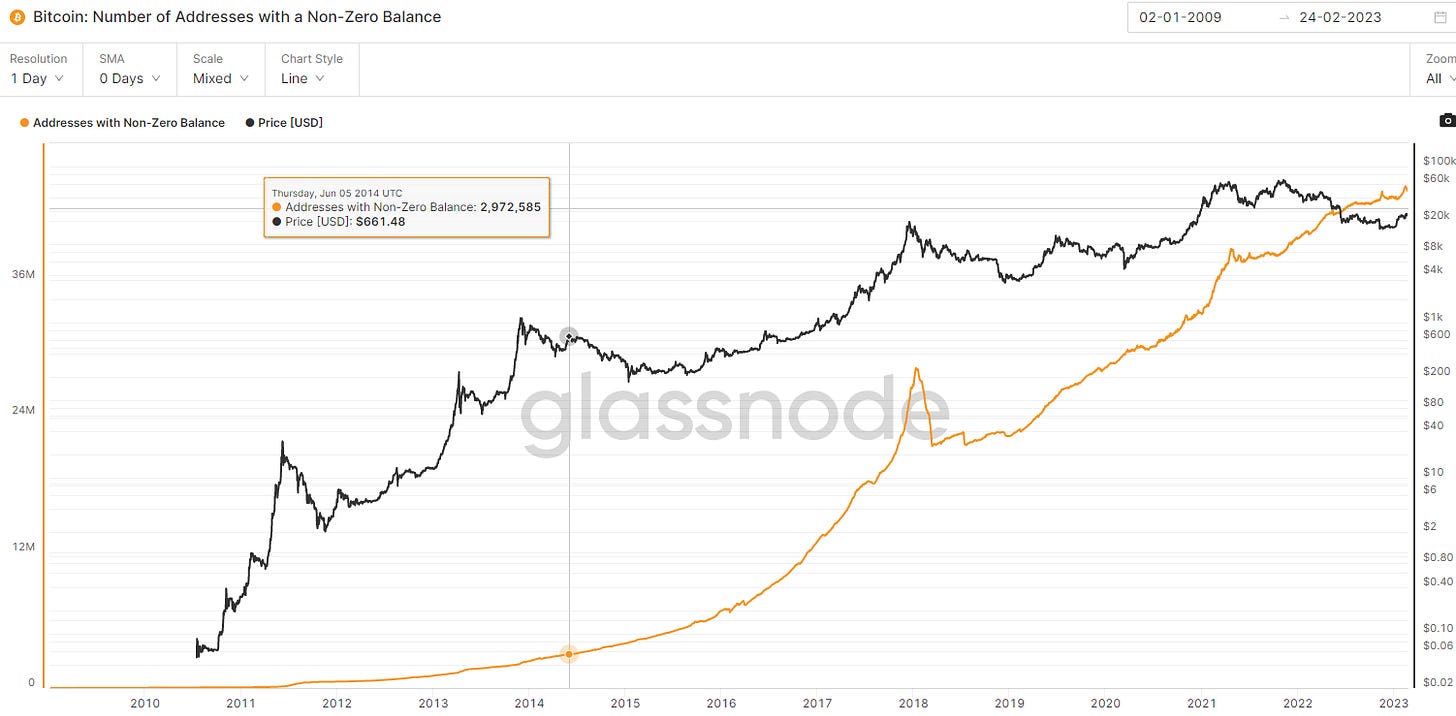
Bitcoin:
Here we get 44 million on-chain addresses holding some BTC. Now, this view is understating the number of users because a lot of retail users leave their BTC on exchanges. But it’s still a big difference from Crypto.com’s report.
Here’s Ethereum:
Ethereum has 94 million non-zero on-chain addresses.
I apologize if your head is spinning already.
But at least we have somewhat of a baseline now for BTC and ETH, and a way to reasonably apply some assumptions around total users/owners. Bitcoin likely has somewhere between 50 and 100 million users/owners today. Ethereum likely has somewhere between 80 -150 million users/owners. These two networks represent 60+ % of the market. Per Crypto.com, 38% of BTC owners also own ETH. 40% of crypto owners own neither BTC nor ETH (NFTs!). When we add it all up, we think it’s fair to conservatively estimate that there are at least 180 million crypto owners out there globally — with maybe double that number having touched it.
Data will never be perfect, but we can come at it from various angles to get a pretty good sense of what’s actually happening. With this understanding, we can then do some relative comparisons — such as the growth of the internet at a similar stage. By all accounts, it appears that crypto adoption is occurring at a faster pace than the internet — which makes sense as the internet already laid down the foundation — and crypto has inherent monetary incentives.
Developers
Developers are critical to the big picture as well. Let’s take a quick look at Bitcoin & Ethereum:
Despite the volatility, up and to the right is what we want to see. Bitcoin is showing steady developer growth from its inception.
Same idea with Ethereum — which has approximately 5x the number of devs as Bitcoin. We would expect to see this because of all the various use cases and applications that Ethereum offers.
Combining these big-picture data points with total VC $ and media/social media activity gives us a good sense of what’s going on.
What do you think?
Should we have the conviction that crypto is here to stay?
Here’s what Warren Buffett and Charlie Munger have to say about all this:
Macro Indicators
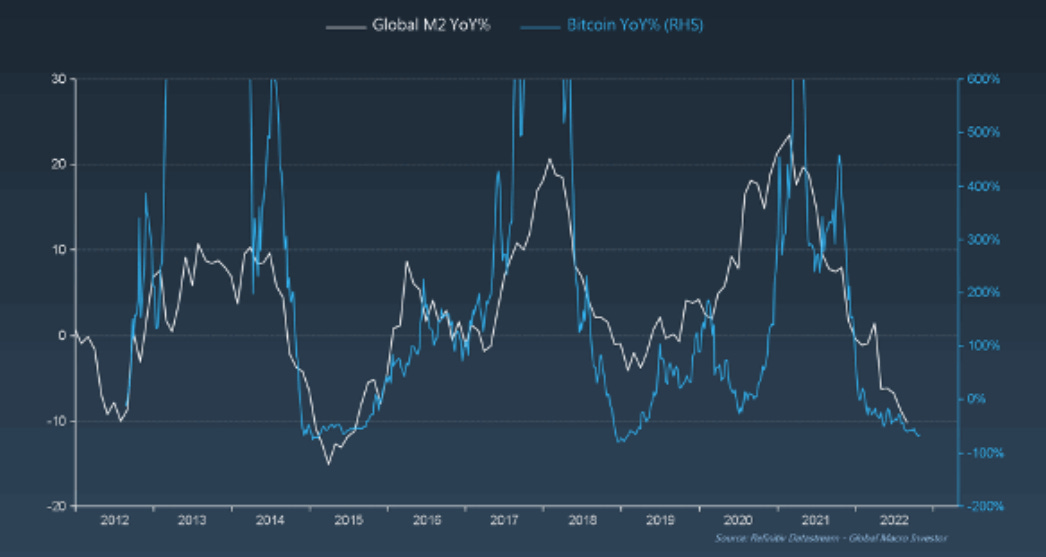
If you’re going to mess with crypto, you really need a basic understanding of macro first. In particular, having an idea of where we’re at, and where we’re heading in the liquidity/interest rate cycle flat-out matters. The below chart showing the relationship between global M2 and Bitcoin tells us why.
Increase liquidity conditions, sprinkle in some leverage, and BTC goes parabolic — literally off the chart in this instance.
If we zoom out on M2 YoY change:
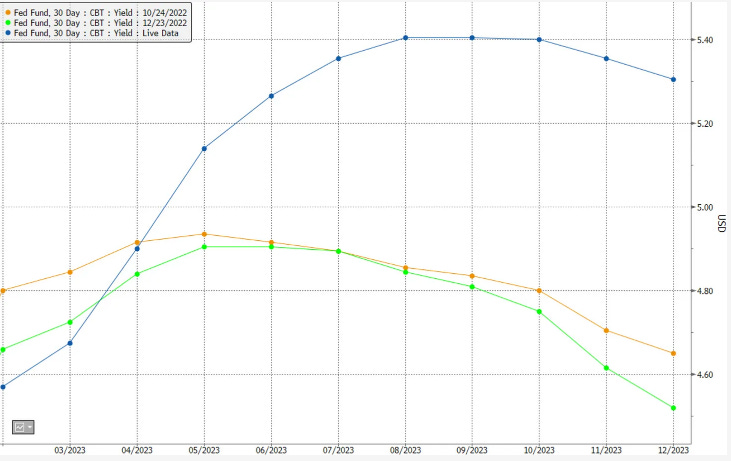
From this view, we think liquidity conditions are more likely to improve later this year. However, after seeing Core PCE (a primary Fed inflation indicator) show a slight uptick last month, we should be cautious in the near term. The market was expecting a drop in PCE to 4.3%. Instead, it rose to 4.7%. Below we can see how market expectations of the fed funds rate have changed from just a few months ago. The “sticky inflation” prognosticators are looking good so far.
As a result, the 2-year treasury yield rallied hard and appears to be tracking 5%:
Finally, the ISM PMI data can give us a boots-on-the-ground view of what is happening with purchasing managers in the manufacturing sector each month. These reports tell us what’s going on with new orders, inventories, production, employment, prices, etc. When we drop below 47 it typically signals a recession — which would in turn signal an easing of monetary conditions. We are right at that level right now. We think this is going lower before it ultimately reverses.
BTC Indicators
There are three primary metrics we look at to identify entry and exit positions for Bitcoin. Keep in mind that this stuff is still pretty new. We only have 13 years to work off of.
200-Week Moving Average:
Bitcoin dropped below its 200-week moving average for the first time in its history last year and has yet to reclaim it. The 200-week moving average currently sits at $25,076. Historically, entering the market at these levels has paid off for long-term investors.
Average Cost to Mine 1 BTC:
Here we are looking at the relative production cost to produce 1 BTC, derived by measuring three variables 1) network difficulty or hash rate, 2) latest mining equipment efficiencies, and 3) average electricity costs. The current cost is $27,683. Again, anytime the price of BTC is at or below these levels, it historically has been a good entry point for folks with a long-term view.
Realized Price:
Realized Price is the average on-chain purchase price of each bitcoin. This is helpful to measure the cost basis — or how much is invested in the Bitcoin Network at any given time. Today the Realized Price is $19,888. Historically, when the actual price collapses toward the Realized Price, it’s a good time to enter for long-term investors.
Layer 1 Metrics & KPIs
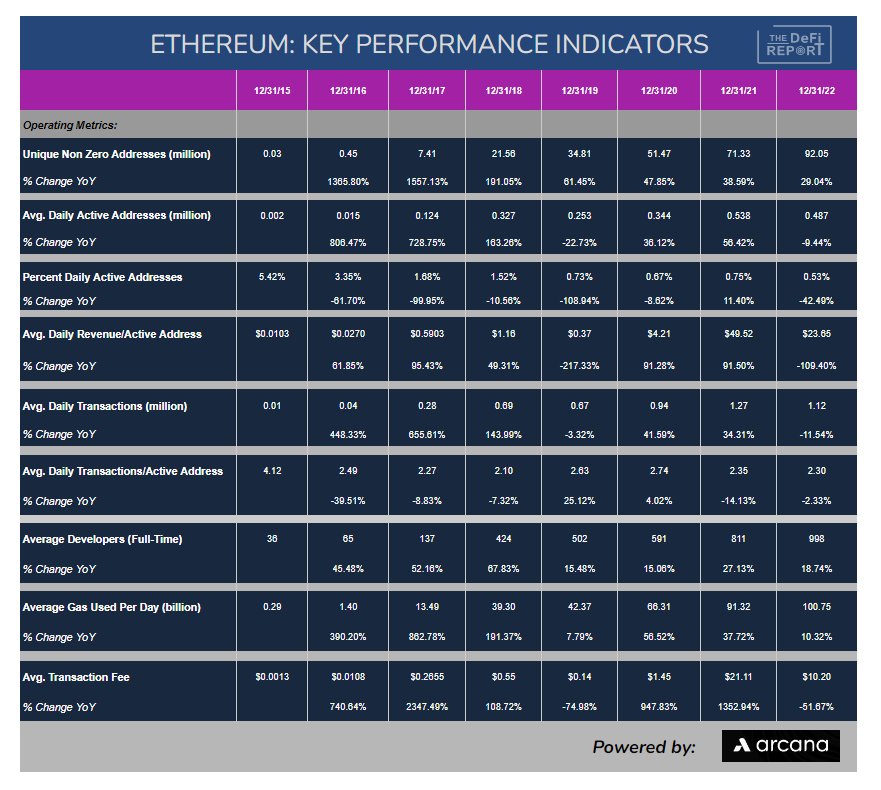
If you look at the above data and believe crypto will be around for some time, you might be inclined to form a thesis on which Layer 1 blockchains will be the winners. To form an opinion, we need some good data. In addition to on-chain financial statements, here’s an example of the metrics we track across L1s, highlighting Ethereum.
Operating Metrics:
Market Metrics & DeFi Metrics:
Since Ethereum has a head start on its competition, it’s helpful to analyze Ethereum against alternative L1s at a similar stage of their development. In this case, we look at Ethereum in early 2019 vs Solana in early 2023. Solana is 4 years old today. Ethereum was 4 years old back then.
DeFi Applications/Protocols
We’ve thrown a lot of numbers and charts at you in this report. In this section, we’ll focus on the most important factor for DeFi protocol success — liquidity — and the logic behind that conclusion. We’ll use Uniswap as our example.
Aggregation Theory suggests that the winning business models of the internet do 1 thing really well to start: Aggregate. It can be content (Google, Netflix). It can be consumer products (Amazon). It can be beds (Airbnb). It can be cars (Uber), etc. It’s all about solving a hard problem, aggregating (something), and then bundling that with other complementary services to integrate vertically and horizontally — while capturing a larger market share. We think this same concept applies to DeFi protocols and web3 business models at large.
Solve a hard problem + Aggregate something (liquidity) + Create a sticky relationship with users (UX & trust) + Integrate Vertically and/or Horizontally = Winning Formula.
Uniswap
Uniswap solved a hard problem: a liquid marketplace for illiquid assets. We think this is a step-change similar to what we saw with Bitcoin (peer-to-peer interaction) and Ethereum (smart contracts).
Uniswap controls 70 + % of the DEX market and has been challenging Coinbase lately in terms of volumes.
Furthermore, Uniswap appears to be creating a sticky relationship with users. For example, we can observe data that shows the % of users going to their interface vs an aggregator like 1inch.
It’s still incredibly early, with many unknowns ahead, including regulation. But if Uniswap maintains this advantage, we should look for them to start integrating horizontally and vertically in the tech stack. And we’re seeing this already. They acquired Genie last year — an NFT marketplace aggregator (horizontal integration). Word has it that they are building a wallet (vertical integration). What’s next? Uniswap could build its own L2 and further integrate vertically within the tech stack — controlling flow and MEV. Who knows if Uniswap will execute, but I think you can see where this is going. It all starts with liquidity.
That’s why we focus on liquidity first and try to understand why various protocols are winning the liquidity battle. We then layer in KPIs such as users and user growth, revenues, DAO governance, token incentives (or lack thereof), unit economics, integrations/composability/network effects, etc.
That’s how we think about DEXs. This same concept applies to lending/borrowing apps. It applies to derivatives platforms. It applies to insurance protocols. It applies to liquid staking protocols. It applies to stablecoins. You get the point.
Web3 Project: Ethereum Name Service
We’ll wrap this up with how we think about web3 projects. We think it’s fascinating to observe the parallels between the build-out of the internet, and the build-out of web3. ENS is an example of this. Before domain names were introduced in 1986, internet users would recognize website addresses by a random string of numbers — enabling the sharing of data and information between computers. The internet didn’t go mainstream until websites were human-readable.
Sound familiar? This is exactly how wallet addresses work today in crypto. Except wallet addresses aren’t just the place you send, receive, and hold crypto from. They can be websites. They can hold your identity. Your NFTs — which could be many things of value. They can be your bank account. Wallets can bundle many services we use in web2 all into one user experience.
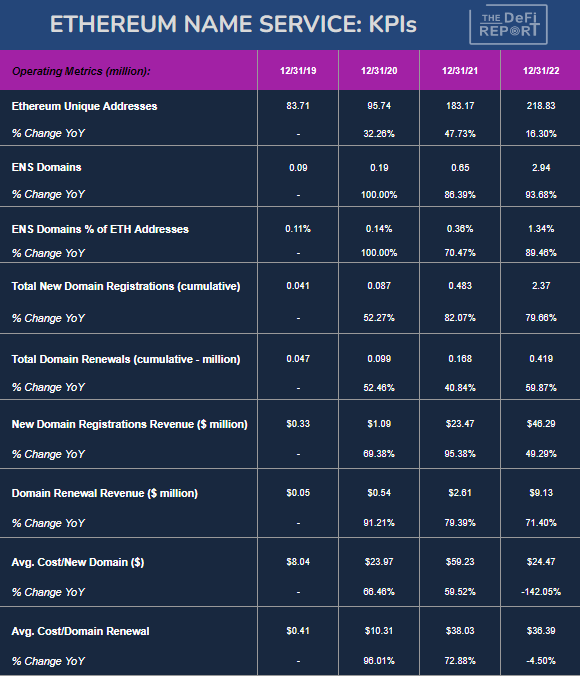
ENS brings a human-readable element to the random string of letters and numbers representing user wallets on Ethereum today. We view ENS as a levered bet on Ethereum — since it’s entirely dependent on Ethereum’s success, but a smaller, lesser-known project. Below are some of the data points we would track to monitor ENS growth and success.
Conclusion
I hope this report helps you level-set around how we use crypto data to form high-level convictions, identify cycles, and then dig into various data points throughout the web3 tech stack. It would be impossible to share everything we look at in one 10-minute read, but I hope this gives you an idea of what the process looks like and why we have long-term confidence in the industry.
Thanks for reading.
If you got some value from the report, please like the post, and share it with your friends, family, and co-workers so that more people can learn about DeFi and web3.
This small gesture means a lot and helps us grow the community.
If you have a comment, thought, or idea, drop it here:
Finally, we provide “analyst as a service” consulting for family offices, investment banks, HNWs, hedge funds, start-ups, and more. Our Starter Pack will get you up to speed with a profesional crypto framework without needing to hire an analyst or a data scientist. To learn more, contact us as mike@thedefireport.io
Take a report.
And stay curious.
Individuals have unique circumstances, goals, and risk tolerances, so you should consult a certified investment professional and/or do your own diligence before making investment decisions. The author is not an investment professional and may hold positions in the assets covered. Certified professionals can provide individualized investment advice tailored to your unique situation. This research report is for general educational purposes only, is not individualized, and as such should not be construed as investment advice. The content contained in the report is derived from both publicly available information as well as proprietary data sources. All information presented and sources are believed to be reliable as of the date first published. Any opinions expressed in the report are based on the information cited herein as of the date of the publication. Although The DeFi Report and the author believe the information presented is substantially accurate in all material respects and does not omit to state material facts necessary to make the statements herein not misleading, all information and materials in the report are provided on an “as is” and “as available” basis, without warranty or condition of any kind either expressed or implied.










JohnC - renewal numbers look pretty good. Here is a dashboard on Dune for reference: https://dune.com/queries/6535/12981
Hi! Quick Question to your thesis:
The risk of successful protocols moving to app chains like Cosmos to avoid Ethereum's moat - can this not be mitigated by the L3's / Superchains which are currently be developed on top of Optimism for example? & If thats the case, ultimately Ethereum will be the base layer again even though that the fees arriving might be lower than what it is now.