Hello DeFi Enthusiasts,
I hope everyone had a nice weekend. Last week we covered the basics for getting set up with an exchange account to buy some crypto, setting up a wallet, and making a transaction. We’ll be following up with part 2 later this week which will cover the various types of wallets, the importance of security in crypto & how to protect yourself, as well as how to track your trades and stay compliant with taxes.
In this report, we’re looking at on-chain metrics for Bitcoin to get a sense of price direction in the near term. I’m using Bitcoin as my marker for the crypto markets as a whole. Bitcoin still makes up almost 50% of the entire crypto market cap. Bitcoin is still the dog. And the rest of the market is still the tail. The dog wags the tail. Until this changes, we’ll continue to focus on Bitcoin for on-chain macro market updates.
This report is brought to you by glassnode, the leading blockchain data & intelligence provider for digital asset stakeholders.
Public blockchains are transparent, open-source networks. Therefore, data is really strong in the industry. We can use the data to analyze the movement of assets between wallets and exchanges as well as the activity of various cohorts in the market to get a sense of overall market sentiment and price direction.
Are whales buying or selling? Are we setting up for a liquidity shock? What’s going on with leverage and funding rates?
Let’s get into it.
With the approval of the first Bitcoin Futures ETF by the SEC last week, the price of Bitcoin shot to all-time highs once again. The last time we established a new all-time high (last December), the price did a 3.2x. The average increase after breaking a new all-time high in the previous 3 instances has been 8.8x over a 166 day period.
It appears we’ve entered a new price epoch. Let’s see if the on-chain data agrees.
Supply Held On Exchanges
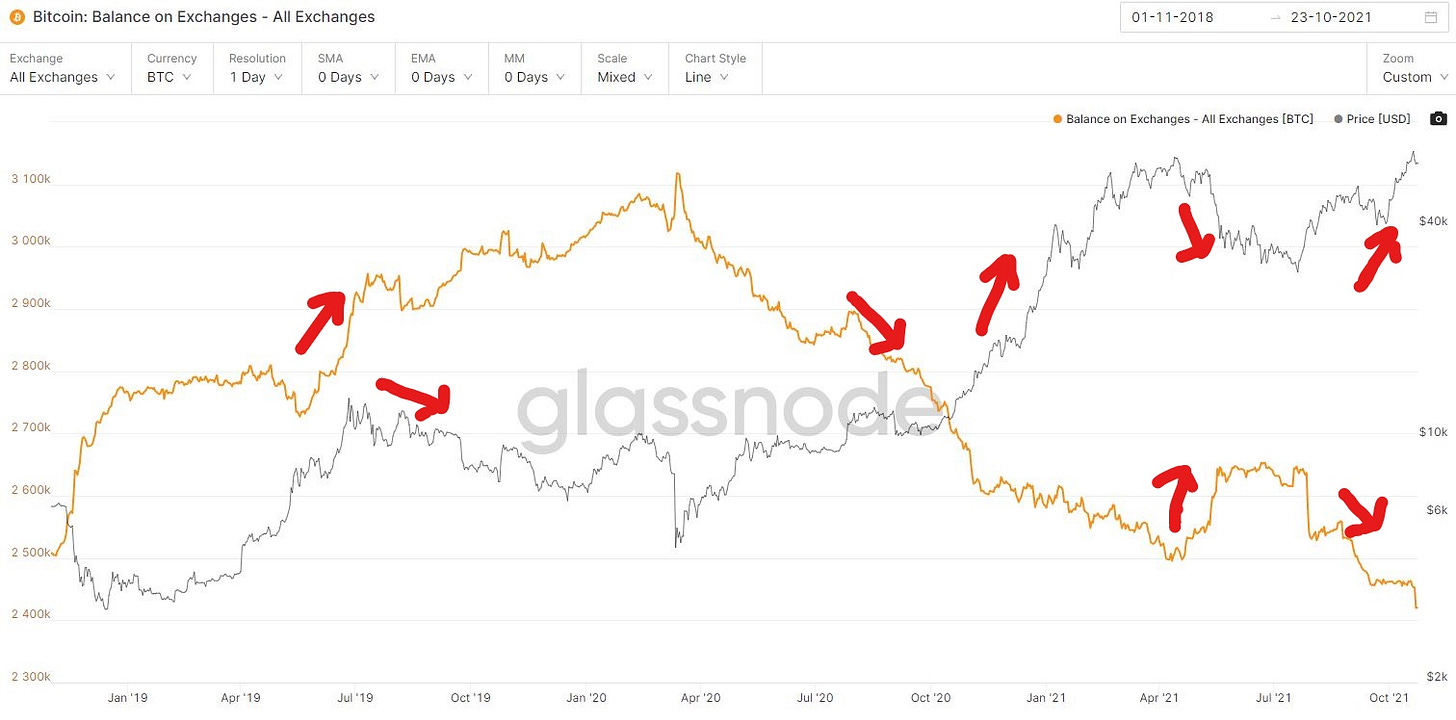
As we can see above, the supply of Bitcoin held on exchanges is strongly correlated to price action. The idea here is that when balances on exchanges increase, price drops. When balances on exchanges decrease, the price runs up.
How to interpret this: seasoned and sophisticated Bitcoin holders tend to keep their assets in cold storage. This means when they buy Bitcoin on an exchange like Coinbase, they immediately transfer it off of the exchange into a personal custody wallet for security reasons (we’ll cover why later this week). So, when exchange balances are dropping, it is a sign that market participants are buying and moving the coins to cold storage.
The opposite is also true. When we see coins being sent into exchanges, it is an indication that these same market participants are sending their bitcoins into the exchange to sell. We can see in the chart that when the yellow line goes up, the black line (price) typically drops.
Today we see the supply on exchanges dropping (yellow line) and the price rising.
Supply held on exchanges is currently at the lowest level since 2018.
Metric Sentiment Today: Bullish.
Illiquid Supply Change
Illiquid Supply Change looks at the activity of various entities on the network. These can be individuals or businesses/corporations with Bitcoin wallets. To measure an entity’s liquidity, glassnode measures the ratio of cumulative outflows from that wallet vs cumulative inflows. A wallet that has more inflows than outflows would be deemed illiquid vs an entity that has a similar amount of inflows vs outflows.
In the chart, we can see that we currently have more illiquid entities on the network than liquid entities. This typically correlates to a rising price until the liquidity profile of various market participants shifts.
Metric Sentiment Today: Bullish.
Institutional Investor Activity
We can measure sentiment from institutional investors by looking at the total assets under management by the Purpose Bitcoin ETF. This is an exchange-traded fund (spot) that trades on the Toronto Stock Exchange. In the US, we just got our first Bitcoin Futures ETF approval by the SEC. This differs from the Canadian ETF in that it does not hold any spot Bitcoin - it is a derivative ETF only.
Below we can see another strong correlation between assets under management and price. We can clearly see that institutions have stepped back into the market and are scooping up shares of the Canadian Purpose Bitcoin ETF.
So, why are we using the ETF to measure institutional activity? Because most large institutions on wall street cannot buy spot bitcoin. Institutional custody solutions in crypto are still quite nascent. And institutions do not want to deal with handling private keys and cold storage. Therefore, it is much easier (and within their compliance/risk guidelines) to simply buy the ETF or Grayscale Bitcoin Trust through a brokerage account as a vehicle for Bitcoin exposure. This is another sign of how early these markets are. How often does retail get first dibs over the large wall street institutions? Never. Until the invention of Bitcoin.
Metric Sentiment Today: Bullish.
Macro View: MVRV Z-Score
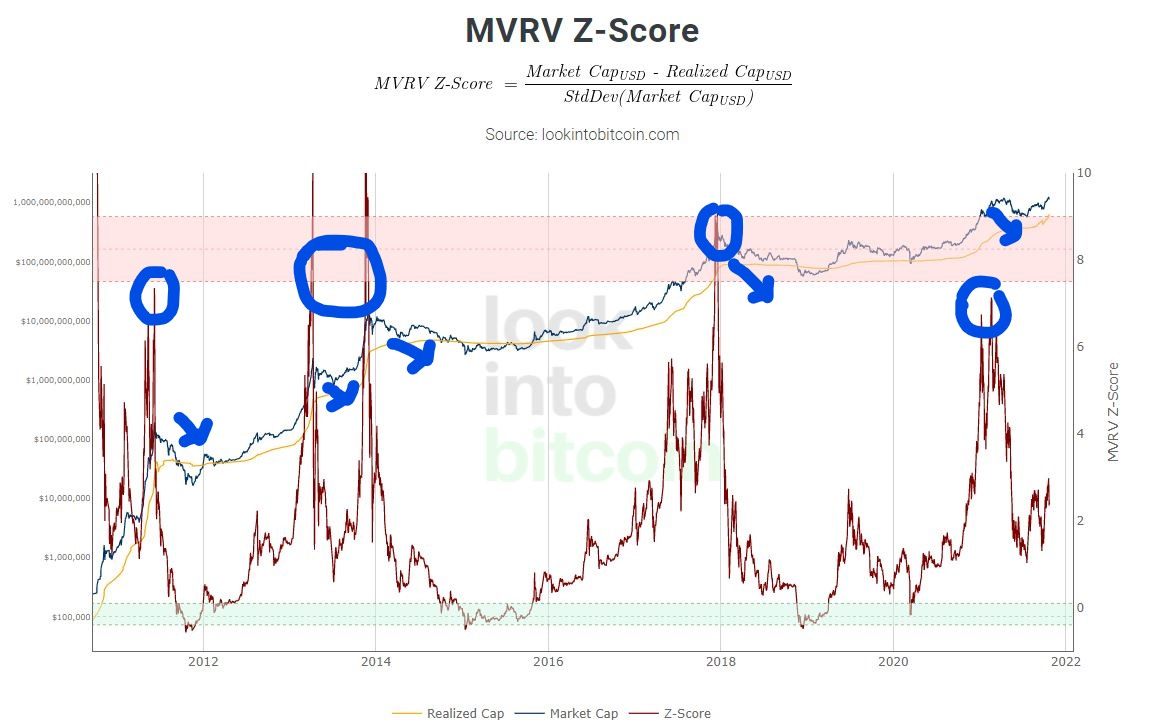
The MVRV Z-Score is measuring Bitcoin's market cap (total coins * price/coin) against it’s realized cap (the estimated cost of all Bitcoins in circulation), adjusted for a standard deviation test that pulls out extremes in the data between market value and realized value.
We use this metric to identify periods where Bitcoin is extremely overvalued or undervalued compared to its “fair value.”
The chart shows us that when the red line (MVRV) moves close to or into the light red band, the price/market cap(blue line) is overheating and a correction is likely imminent. We’ve seen this correlation in every bull market in Bitcoins history. We even saw it just last April/May when the price got hot and we had a quick 50% correction.
Today, we can see that the MVRV ratio is nowhere near the light red band.
Metric Sentiment Today: Bullish.
Leverage & Derivatives
Below we have the Bitcoin Perpetuals Funding Rate. This gives us an idea of trader sentiment in the market as well as the amount of leverage being deployed. Funding rates also indicate the premium traders must pay to keep a position open.
When the funding rate is positive and rising, it is telling us that trader sentiment is positive and they are starting to get greedy. These traders are also adding leverage to their trades in order to juice their returns with momentum trading. Anytime we see leverage building in Bitcoin, it is an indicator that some volatility might be on the horizon. We can think of leverage in the same way we think of a game of Jenga. As leverage increases, the sturdiness of the market direction gets weaker and weaker. Sort of like the end of a game of Jenga, when the blocks become quite wobbly. We can see in the chart that funding rates shot up on the day we hit the all-time price high. And right on queue, we had some price volatility to the downside thereafter.
Metric Sentiment Today: Neutral.
Open Interest
Open interest tells us the total amount of funds currently in futures contracts. However, it does not give us an idea of whether these bets are placed in long or short contracts. We just know there are lots of market participants betting on price direction using derivatives. Open interest tends to get frothy near the top of a bull market.
Above, we can see that as the price is rising, open interest is rising with it. Open interest levels are currently at a similar level to last March/April when things got a bit frothy and we had a significant pullback. That said, I’ll note that we had the China ban of mining at the same time which forced a lot of selling activity from miners, wiping out leverage & futures interest, pushing the price down. I consider that event more of a black swan than completely driven by excess leverage and open interest. In any event, increasing leverage and open interest are always indicators that volatility is about to pick up.
Metric Sentiment Today: Neutral.
Large Holders
One of the interesting, and positive developments we see with Bitcoin is that the distribution of coins is becoming less consolidated and more widespread over time. Below we can see the number of addresses with more than 100 bitcoin dropping over time.
This is great to see, but these large holders still have a significant influence on price. If we look closely, we can see periods of buying and selling and how this cohort impacts price. They were selling last April/May when the price dropped significantly. However, buying picked up again toward the end of September, and we can see the corresponding pop in price.
Market Sentiment Today: Bullish.
Conclusion
The on-chain data is telling us that the big picture looks very healthy right now. However, leverage is picking up and market conditions can change quite quickly. Any sharp moves in price in the near term to the downside would likely be the result of leverage being wiped out. This is typical in any bull run and is not indicative of the larger bullish picture.
Furthermore, Bitcoin is becoming a large, macro asset right before our eyes. Interest rates and risk on/risk off within growth assets as well as unforeseen macro forces can also impact the price of Bitcoin outside of just the on-chain data.
We’ll continue to monitor these metrics as we head into November/December and the winter months.
___
Thanks for reading and for your continued support. Have a question, comment, or thought? Leave it here:
And if you’re getting value from these reports, please consider sharing them with your friends, family, and social networks so that more people can learn about crypto and blockchains.
Finally, if you would like to send me a tip, you can do so through the addresses below. If you do send a tip, please be sure to let me know so that I can send you a thank you note.
Bitcoin: bc1qghetd4g3lk7qnsn962amd9j92mkl4388zxz0jz
Ethereum: 0x084fcd3D9318bAa383B9a9D244bC0c32129EE20E
Shout out to Glassnode for providing the data powering this report and analysis.
___
Take a report.
And stay curious my friends.
Individuals have unique circumstances, goals, and risk tolerances, so you should consult a certified investment professional and/or do your own diligence before making investment decisions. Certified professionals can provide individualized investment advice tailored to your unique situation. This research report is for general investment information only, is not individualized, and as such does not constitute investment advice.


