Analyzing Flows Between Blockchains
Which blockchain is attracting the hot ball of money out there?
Hello readers,
You know what they say about following the money. Well, the cool thing about public blockchains is we can do exactly that with onchain data.
As the infrastructure connecting blockchains improves, network effects and economic moats within any single network could become harder and harder to come by.
As such, we’ve been studying the net flows across the top 15 L1s and L2s to surface exactly where value is flowing within public blockchain networks — and now it’s time to share our findings with you.
Topics Covered:
Blockchains Gaining the Most Net Flows
Source Chains for the Winning Networks
Specific *Projects* Gaining Flows Within the Winning Blockchains
Blockchains Losing the Most Net Flows
Destination Chains for the Losing Networks
Key Takeaways
Disclaimer: Views expressed are the author’s personal views and should not be taken as investment or legal advice.
Let’s make quality free content a win/win! If you find our research & analysis helpful, please like the post — which can be done directly from your inbox via the heart button in the upper left. This helps grow the community and responsibly introduce more people to crypto and Web3.
Let’s go.
Which Blockchains are Gaining the most Net Flows?
The Winners:
As we can see, Arbitrum is the big winner — picking up over $2.3 billion of net flows from the other chains over the last 3 months.
Optimism was #2 — with nearly $800m of net inflows over the same period.
Starkware came in #3 with over $700m of net inflows.
Base was #4, bringing in nearly $600m over the last 3 months.
Finally, SUI rounds out the top 5 with $423m and is the only non-EVM chain that saw significant inflows over the last 90 days.
The Losers:
Ethereum saw over $3.6b of net outflows over the last 90 days. With that said, over $4.4b came *into* the Ethereum ecosystem via L2s over the same time period. L2s pay settlement fees to ETH L1 so these funds haven’t really left Ethereum.
zkSync had over $1 billion leave its ecosystem over the last 3 months (more on this later).
Avalanche saw over $500 million leave its ecosystem (more on this later).
Where are Arbitrum’s Net Inflows Coming From?
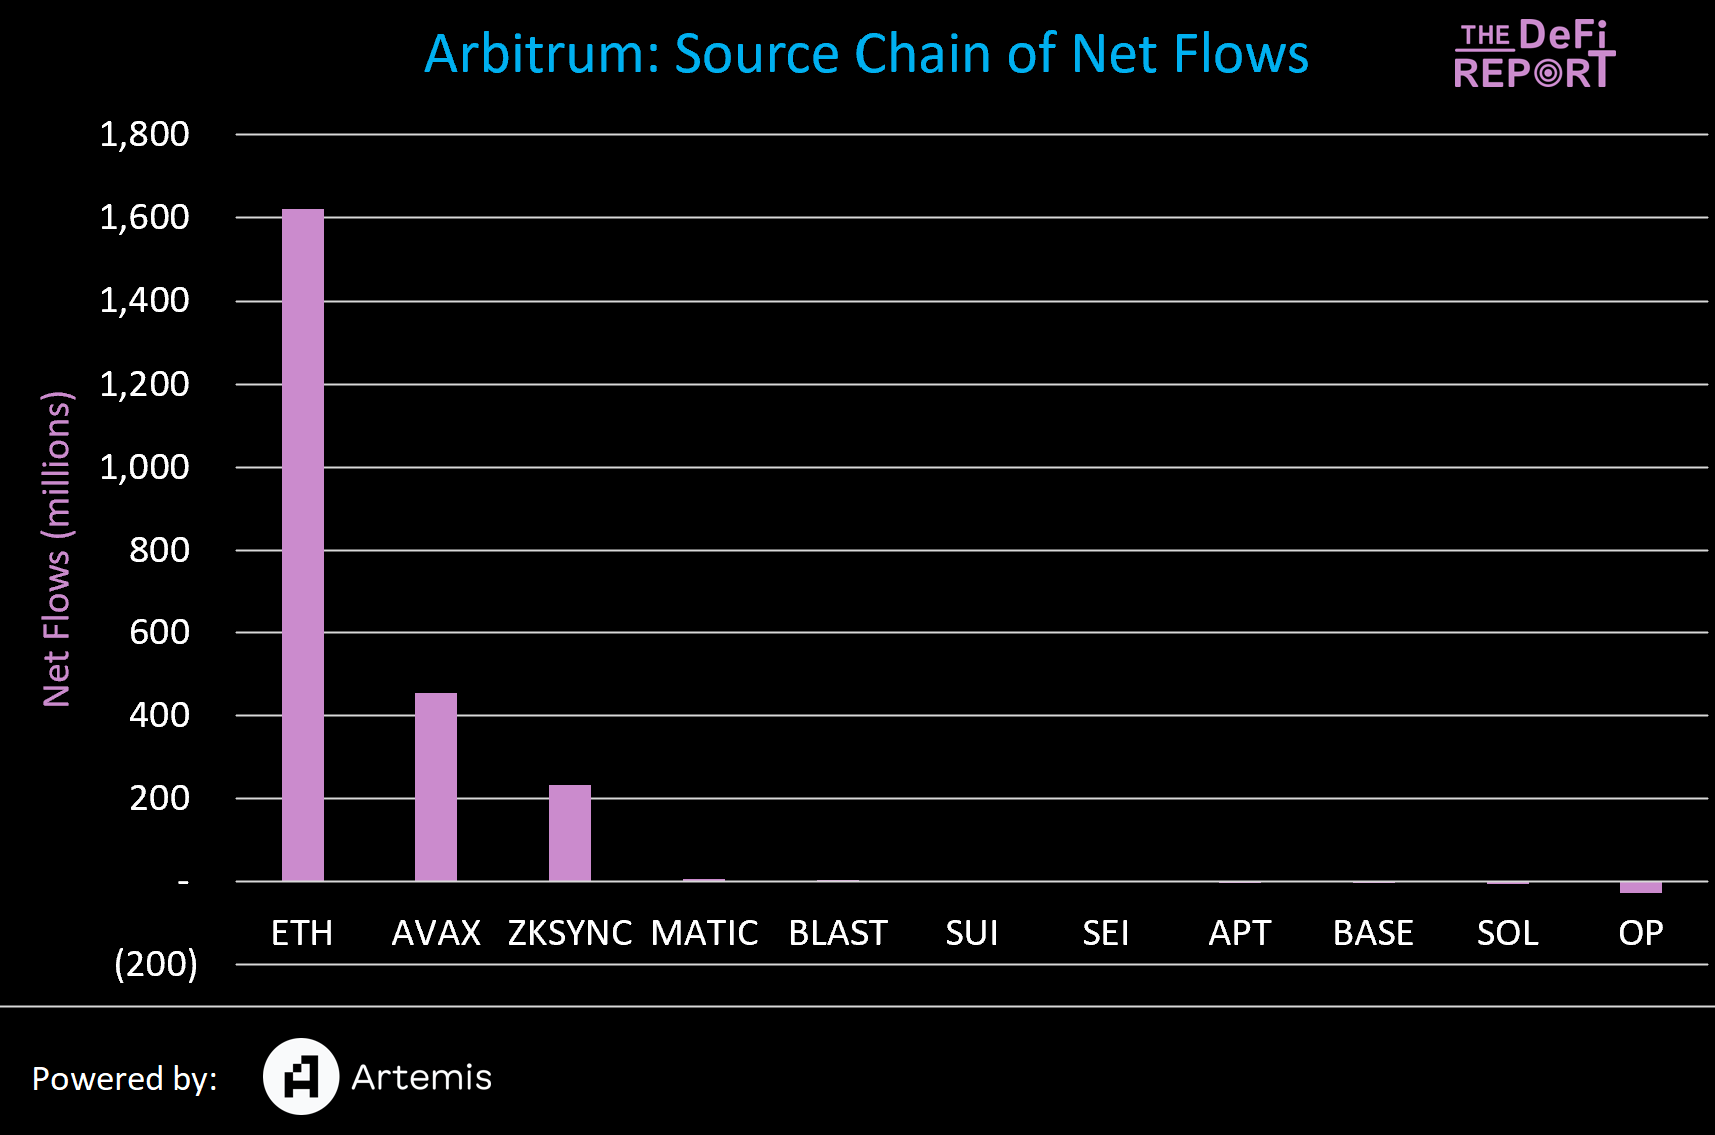
As we can see, the vast majority of Arbitrum’s inflows (70%) are coming in from Ethereum L1. About 25% of these flows are stablecoins with other tokens representing 75% of the value. We expect to see value leaving ETH L1 for the most popular L2s.
But what is unexpected is that nearly $500m of value left the Avalanche ecosystem for Arbitrum. If we revisit the first chart, Avalanche is one of the big losers of the cohort with $543m leaving the ecosystem over the last quarter. 84% of this value went to Arbitrum.
The DeFi Report is powered by Token Terminal — the leading onchain data & analytics platform for institutional investors. Sign up for a *free* PRO Account on Token Terminal ($4k annual license) at the link here: FREE PRO ACCOUNT
Subscribe for free data-driven research covering the Web3 tech stack from first principles & onchain data.
Which Projects on Arbitrum are catching these Flows?
We can’t say for certain which projects on Arbitrum are catching the flows, but the projects above are driving the most gas consumption on Arbitrum over the last quarter.
When we observe the 90-day trends, RabbitHole (a game) sticks out as its gas consumption is up 1,147% over the last quarter per Token Terminal.
Another interesting observation on Arbitrum was that Pyth Network (the leading data oracle within Solana) saw a 600% increase in gas consumption via oracles tied to Arbitrum over the last quarter.
Blockchains Losing the Most Net Flows
We covered Avalanche already. But zkSync (ETH L2) lost over $1 billion of value over the last 90 days.
Where did it go?
$328m went to Optimism
$313m went to Ethereum
$232m went to Arbitrum
$37m went to Base
The takeaway: All of the value that left zkSync stayed in the Ethereum ecosystem.
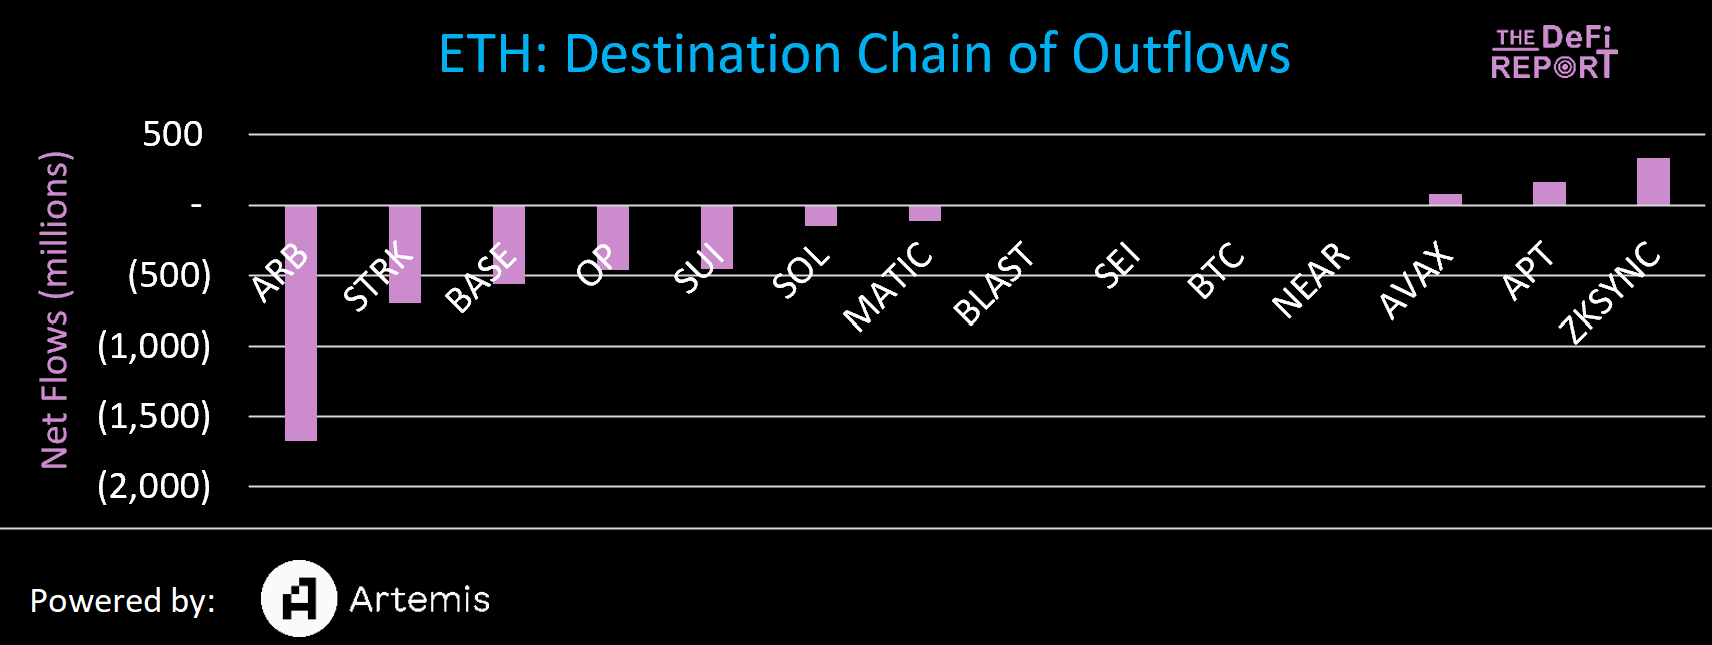
And what about Ethereum? We know that Arbitrum picked up $1.6b from Ethereum, but where did the rest of the flows move to?
The vast majority of Ethereum’s net outflows stayed within the Ethereum ecosystem as well — accruing to Starknet, Base, and Optimism.
SUI was the biggest non-EVM beneficiary of Ethereum outflows — picking up $452m. Solana captured $152m from Ethereum.
Key Takeaways
Long-time readers (and/or readers of The Ethereum Investment Framework) know that we expect value to move up the tech stack as public blockchain networks mature.
We also expect to see 3-5 major L1s when it’s all said and done (and possibly a long tail of less significant layer 1 blockchains).
But as bridging infrastructure matures (along with account abstraction), we should expect value to flow freely in and out of various networks and ecosystems — making impenetrable network effects and economic moats harder to come by.
With that said, below are our key takeaways from analyzing the movement of flows throughout the major L1s and L2s.
Ethereum
The largest L1 may have lost a significant amount of value, but it was picked up at the L2 level. This is bullish for ETH in my opinion. If we see value leaving the L1 and *not* going to L2, but rather leaving the ecosystem all together — this would be a red flag. To be clear, we are not seeing this today.
Furthermore, Ethereum’s TVL is up 60% over the last 3 months despite over $3 billion of net flows leaving the ecosystem — highlighting the flaws of TVL as a KPI (dependent on the highly volatile value of the underlying assets and is easily gameable).
Solana
Solana’s net inflows over the last 3 months across 15 of the largest L1s and L2s was just $169 million. Over the same period, Solana’s TVL grew from $1.4b to $4.5b (221% increase).
So how did that happen?
The price of SOL rose from $100 to $171 over the last 3 months (77% increase).
More SOL is being added to liquid staking solutions (Marinade, Jito, BlazeStake)
Several projects issued tokens within the ecosystem such as Jito, Pyth, Jupiter, and Tensor — creating a wealth effect to the tune of billions of dollars — some of which has stayed in Solana DeFi.
Of course, meme coin season has been in frenzy mode on Solana for months now — increasing trading volumes and “value locked.”
Solana’s growth in TVL has been largely organic from within the ecosystem.
This doesn’t mean we won’t see value leave Ethereum for Solana at some point and stay there. But we are not seeing that in the data today.
SUI
SUI was the big winner amongst the new-age “high throughput” blockchains. It picked up net flows of $423m with the vast majority coming from Ethereum. It appears that this was the primary catalyst that drove SUI TVL from $220m up to $660m today.
Bridges
As noted, with bridging infrastructure maturing, the flow of value in and out of various networks could accelerate — driving value away from any particular L1 (s) and possibly to the bridges themselves. To be clear, we are not seeing this today but are monitoring it nonetheless.
Wormhole is one of the largest bridges today. It provides interoperability between Solana, Ethereum, Arbitrum, BNB, Avalanche, Optimism, Near, and Polygon.
The team recently launched its token at a $10b fully diluted valuation. This figure is similar to Ethereum L2s — a strong and noteworthy market signal for bridging infrastructure.
As ever, the data lights the path. We’ll keep you up to speed as the infrastructure continues to mature.
Thanks for reading.
If you got some value from the report, please like the post (heart button in the upper left of your inbox), and share it with your friends, family, and co-workers so that more people can learn about DeFi and Web3.
Finally, if you have a comment, thought, or idea — drop it here:
Take a report.
And Stay Curious.
Disclaimer: Individuals have unique circumstances, goals, and risk tolerances, so you should consult a certified investment professional and/or do your own diligence before making investment decisions. The author is not an investment advisor and may hold positions in the assets covered. Certified professionals can provide individualized investment advice tailored to your unique situation. This research report is for general educational purposes only, is not individualized, and as such should not be construed as investment advice. The content contained in the report is derived from both publicly available information as well as proprietary data sources. All information presented and sources are believed to be reliable as of the date first published. Any opinions expressed in the report are based on the information cited herein as of the date of the publication. Although The DeFi Report and the author believe the information presented is substantially accurate in all material respects and does not omit to state material facts necessary to make the statements herein not misleading, all information and materials in the report are provided on an “as is” and “as available” basis, without warranty or condition of any kind either expressed or implied.


Hey Micheal
Great read and analysis on fund flows.
Wanted to share our report on DeFi yield trends and how a lot of capital is actually in low risk pools. Curious to hear your thoughts https://exponential.fi/blog/the-dawn-of-a-new-era-in-defi-from-winter-chills-to-summer-thrills